
Hurricane Ian: forecasting of the coastal storm surge
The storms connected to the Hurricane Ian is continuing to threaten the coastal areas of Georgia, Virginia and South Carolina states in US.
Here we show the real-time sea level forecasts of the modelling system named S-WITCH (Savannah – Water Integrated Tool for ocean, Coastal and river Hydraulics forecasting, https://savannah.cmcc.it) for the case of the Ian Hurricane hitting the Georgia coasts. The system, developed by CMCC in collaboration with Georgia Institute of Technology (Atlanta, GA, US), provides hyper-resolution coastal hydrodynamic fields (up to meters of spatial resolution) along the Georgia coastal waters, with specific focus on the river-sea continuum of the Savannah River. The capabilities of the modelling system were already proved in storm surge events induced by the Hurricanes Matthew (2016) and Dorian (2019) (Park et al., 2022), using a downscaling approach from the Copernicus Marine Service (CMEMS, https://marine.copernicus.eu/) global forecasting system.
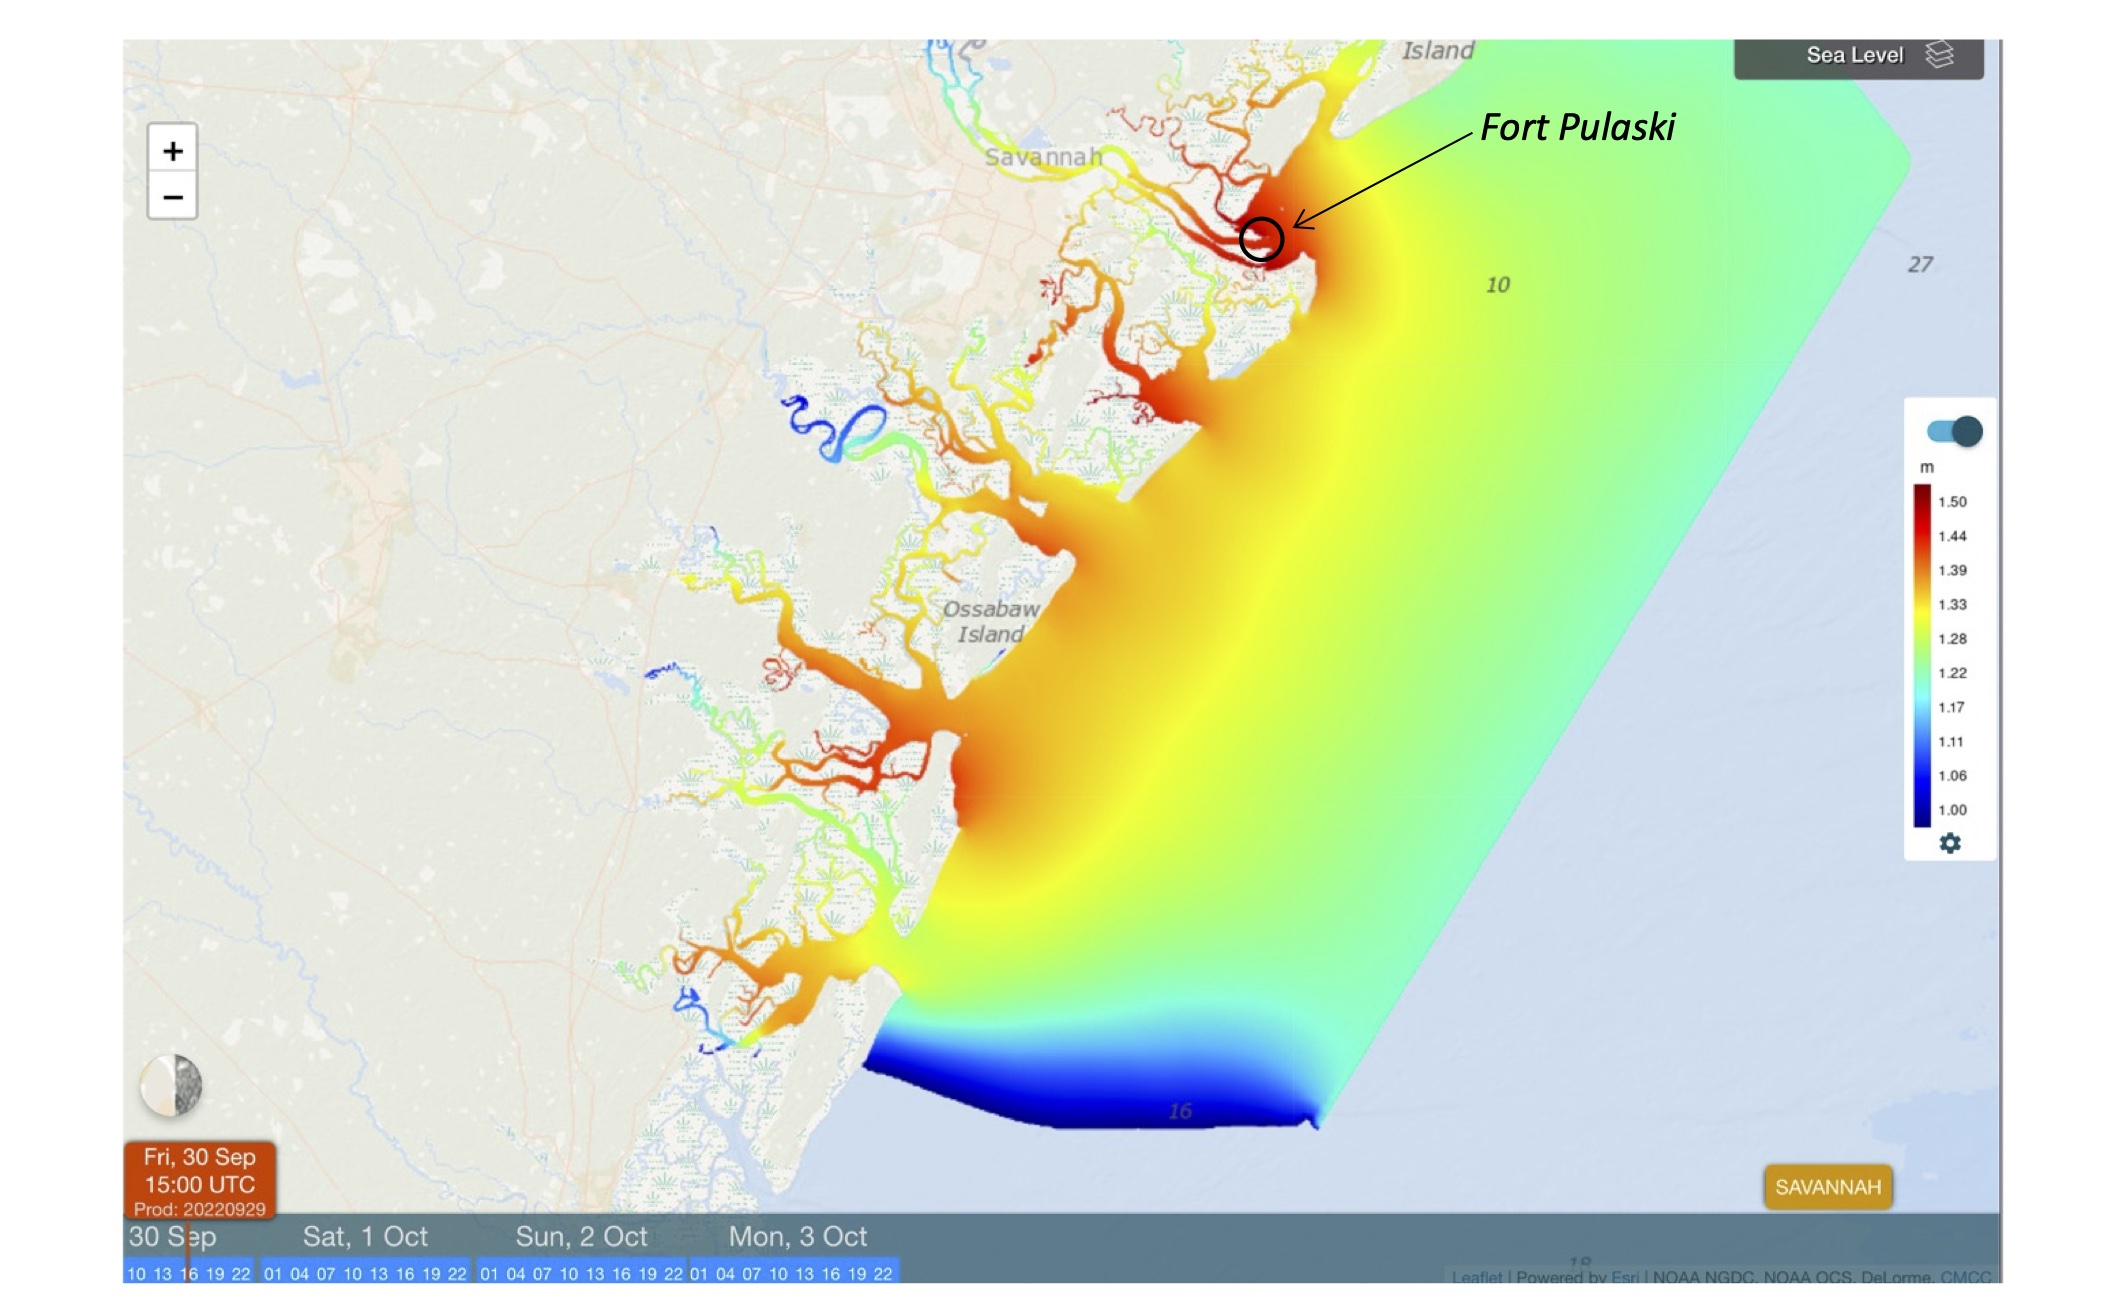
For the Ian Hurricane, the operational system forecasted the maximum sea level on 30th September at 15:00 UTC time along the Georgia coasts, as shown in Fig. 1 and 2. The sea level map in Fig. 1 shows a spatial pattern of the surge extending from the southern part of Ossabaw island to the Savannah area, with a local peak entrapped at the river mouth of Savannah River. This evidence is also clear in Fig. 2, where we report the sea level timeseries at the Fort Pulaski point, located at the mouth of Savannah River as indicated in Fig. 1. The maximum surge and maximum total water level predicted by the CMEMS global forecasting system and by S-WITCH coastal forecasting system are between 15:00-16:00 UTC. The total water level highlights a very close co-occurrence between the maximum surge and the flood tides.
The evidence of the passage of the Hurricane uptaking the heat from the ocean is also clear in the cooling of the surface ocean waters of about 3.5°C in front of the Southeast coast (on 2 October, Fig. 3b) in respect to the pre-storm condition (on 28 September, Fig. 3a), as predicted from the CMCC Global Ocean Forecasting System (GOFS16, available at http://gofs.cmcc.it). In Fig. 3c we show the rapid drop of surface temperature for a coastal point of South Caroline (SC1 in Fig. 3a).
The GOFS16 global model, thanks to the high spatial resolution (1/16°), is capable also to reproduce local storm surge in coastal embayment areas, as reported in Fig. 4a for the Long Bay in northern part of South Caroline. The timeseries in Fig. 4b for SC2 show the high-frequency response (less than 6 hours, from 30 Sep 20:00 to 01 Oct 02:00) of sea level to the passage of the hurricane and the typical pattern of rebounding effect in the post-hurricane period.
The forecasting experiment here described underlines how a joint effort between a cross-scale modelling (from global to coastal and river scale) could enhance the understand of processes and support decision makers to manage hurricane-induced risks.
Figure 1: Sea level forecasted by S-WITCH system on 30th September 2022 at 15:00 UTC for the Georgia coasts.
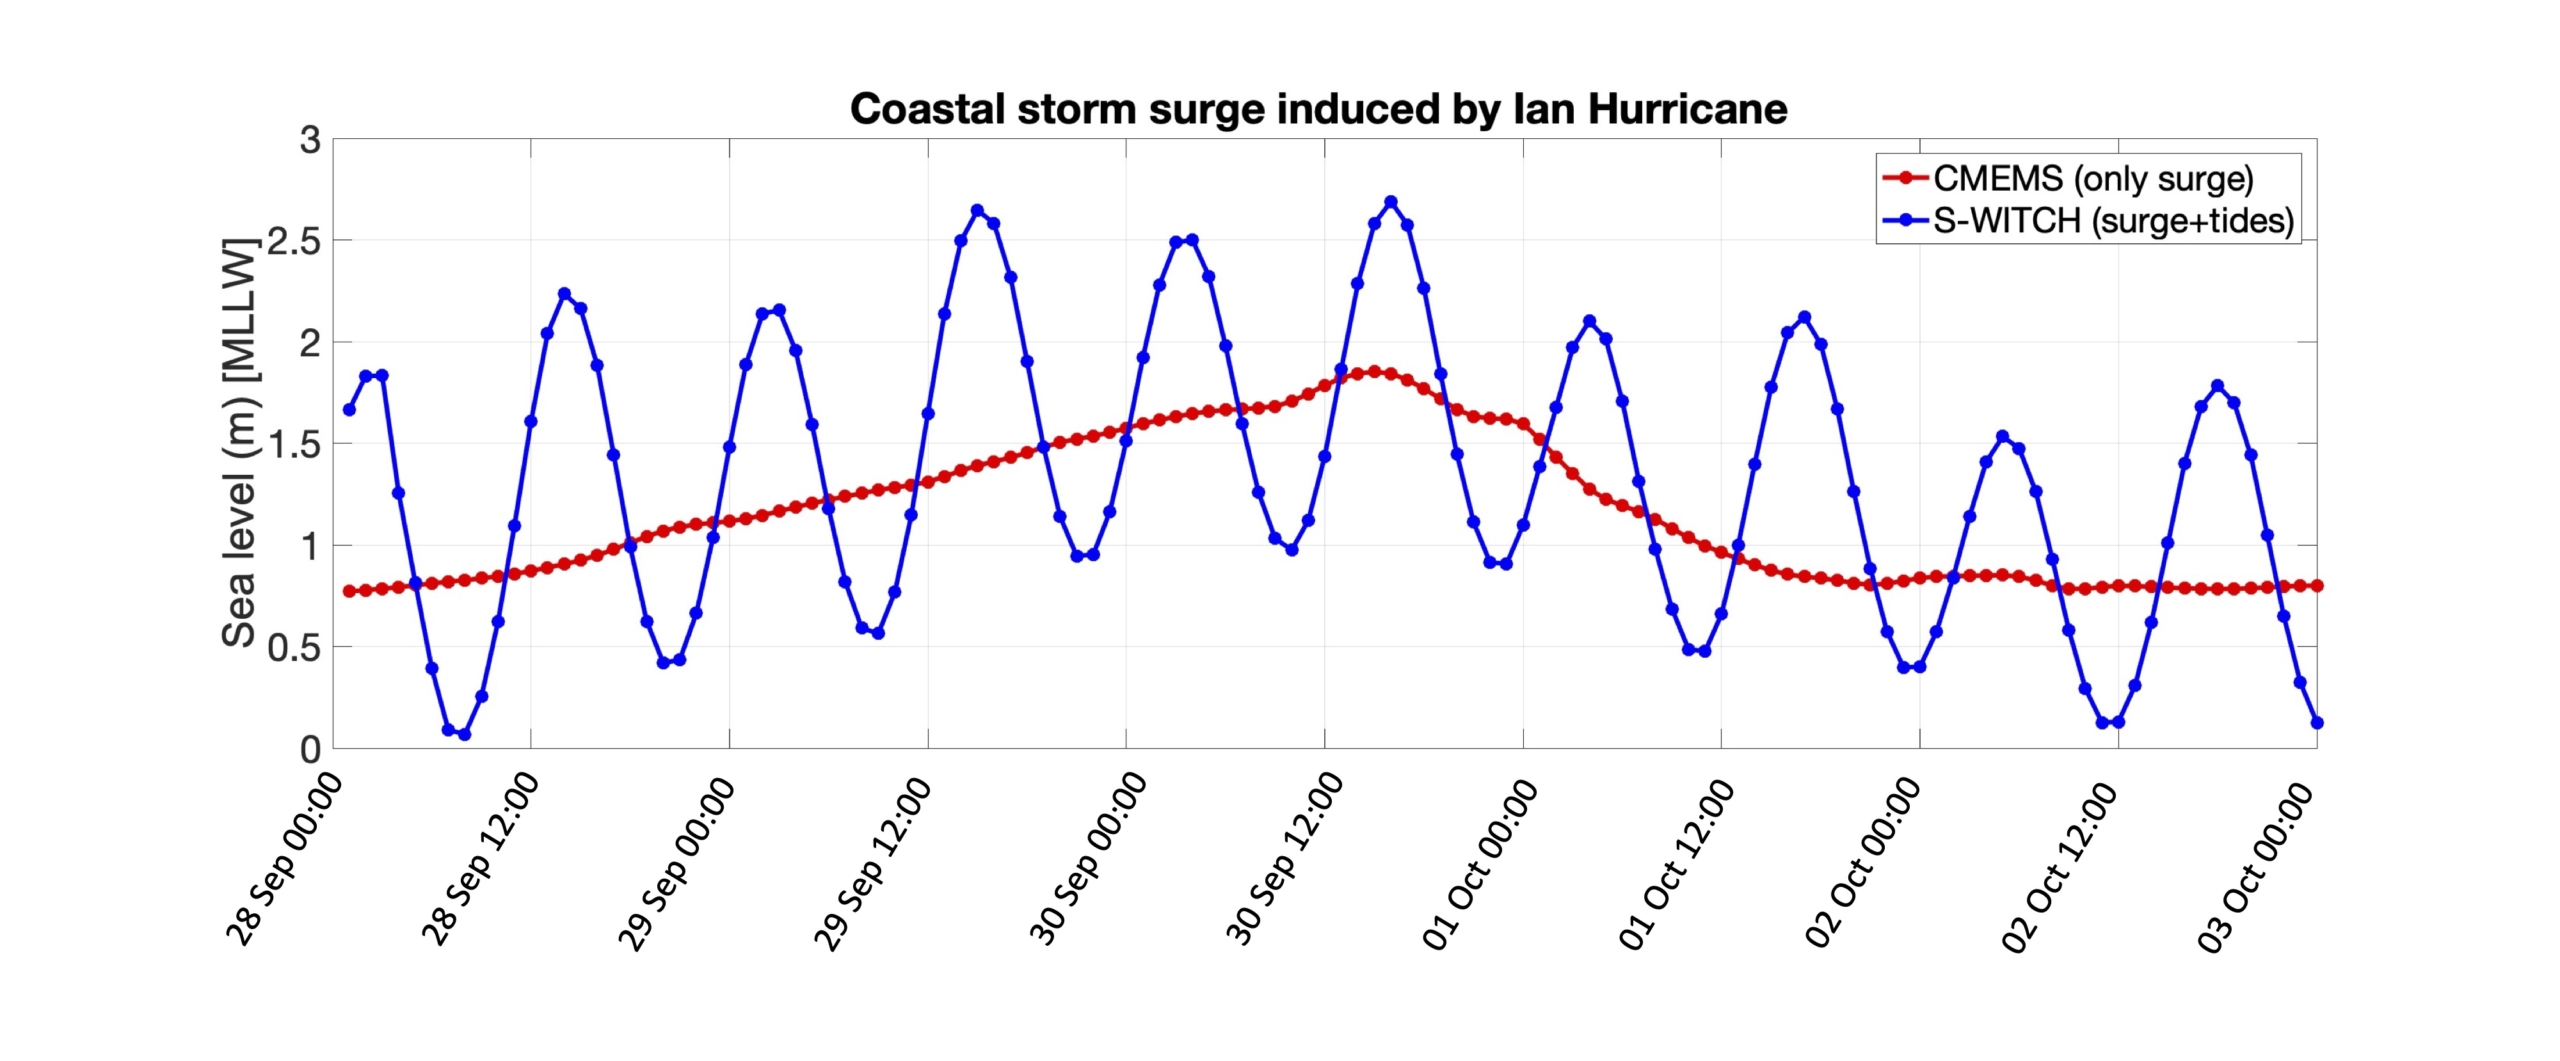
Figure 2: Sea level timeseries predicted by SWITCH in Fort Pulaski, located at the mouth of Savannah River as indicated in Fig. 1. The reference sea level is reported in mean lower low water (MLLW) as indicated in NOAA vertical datum (https://tidesandcurrents.noaa.gov/datums.html?id=8670870).
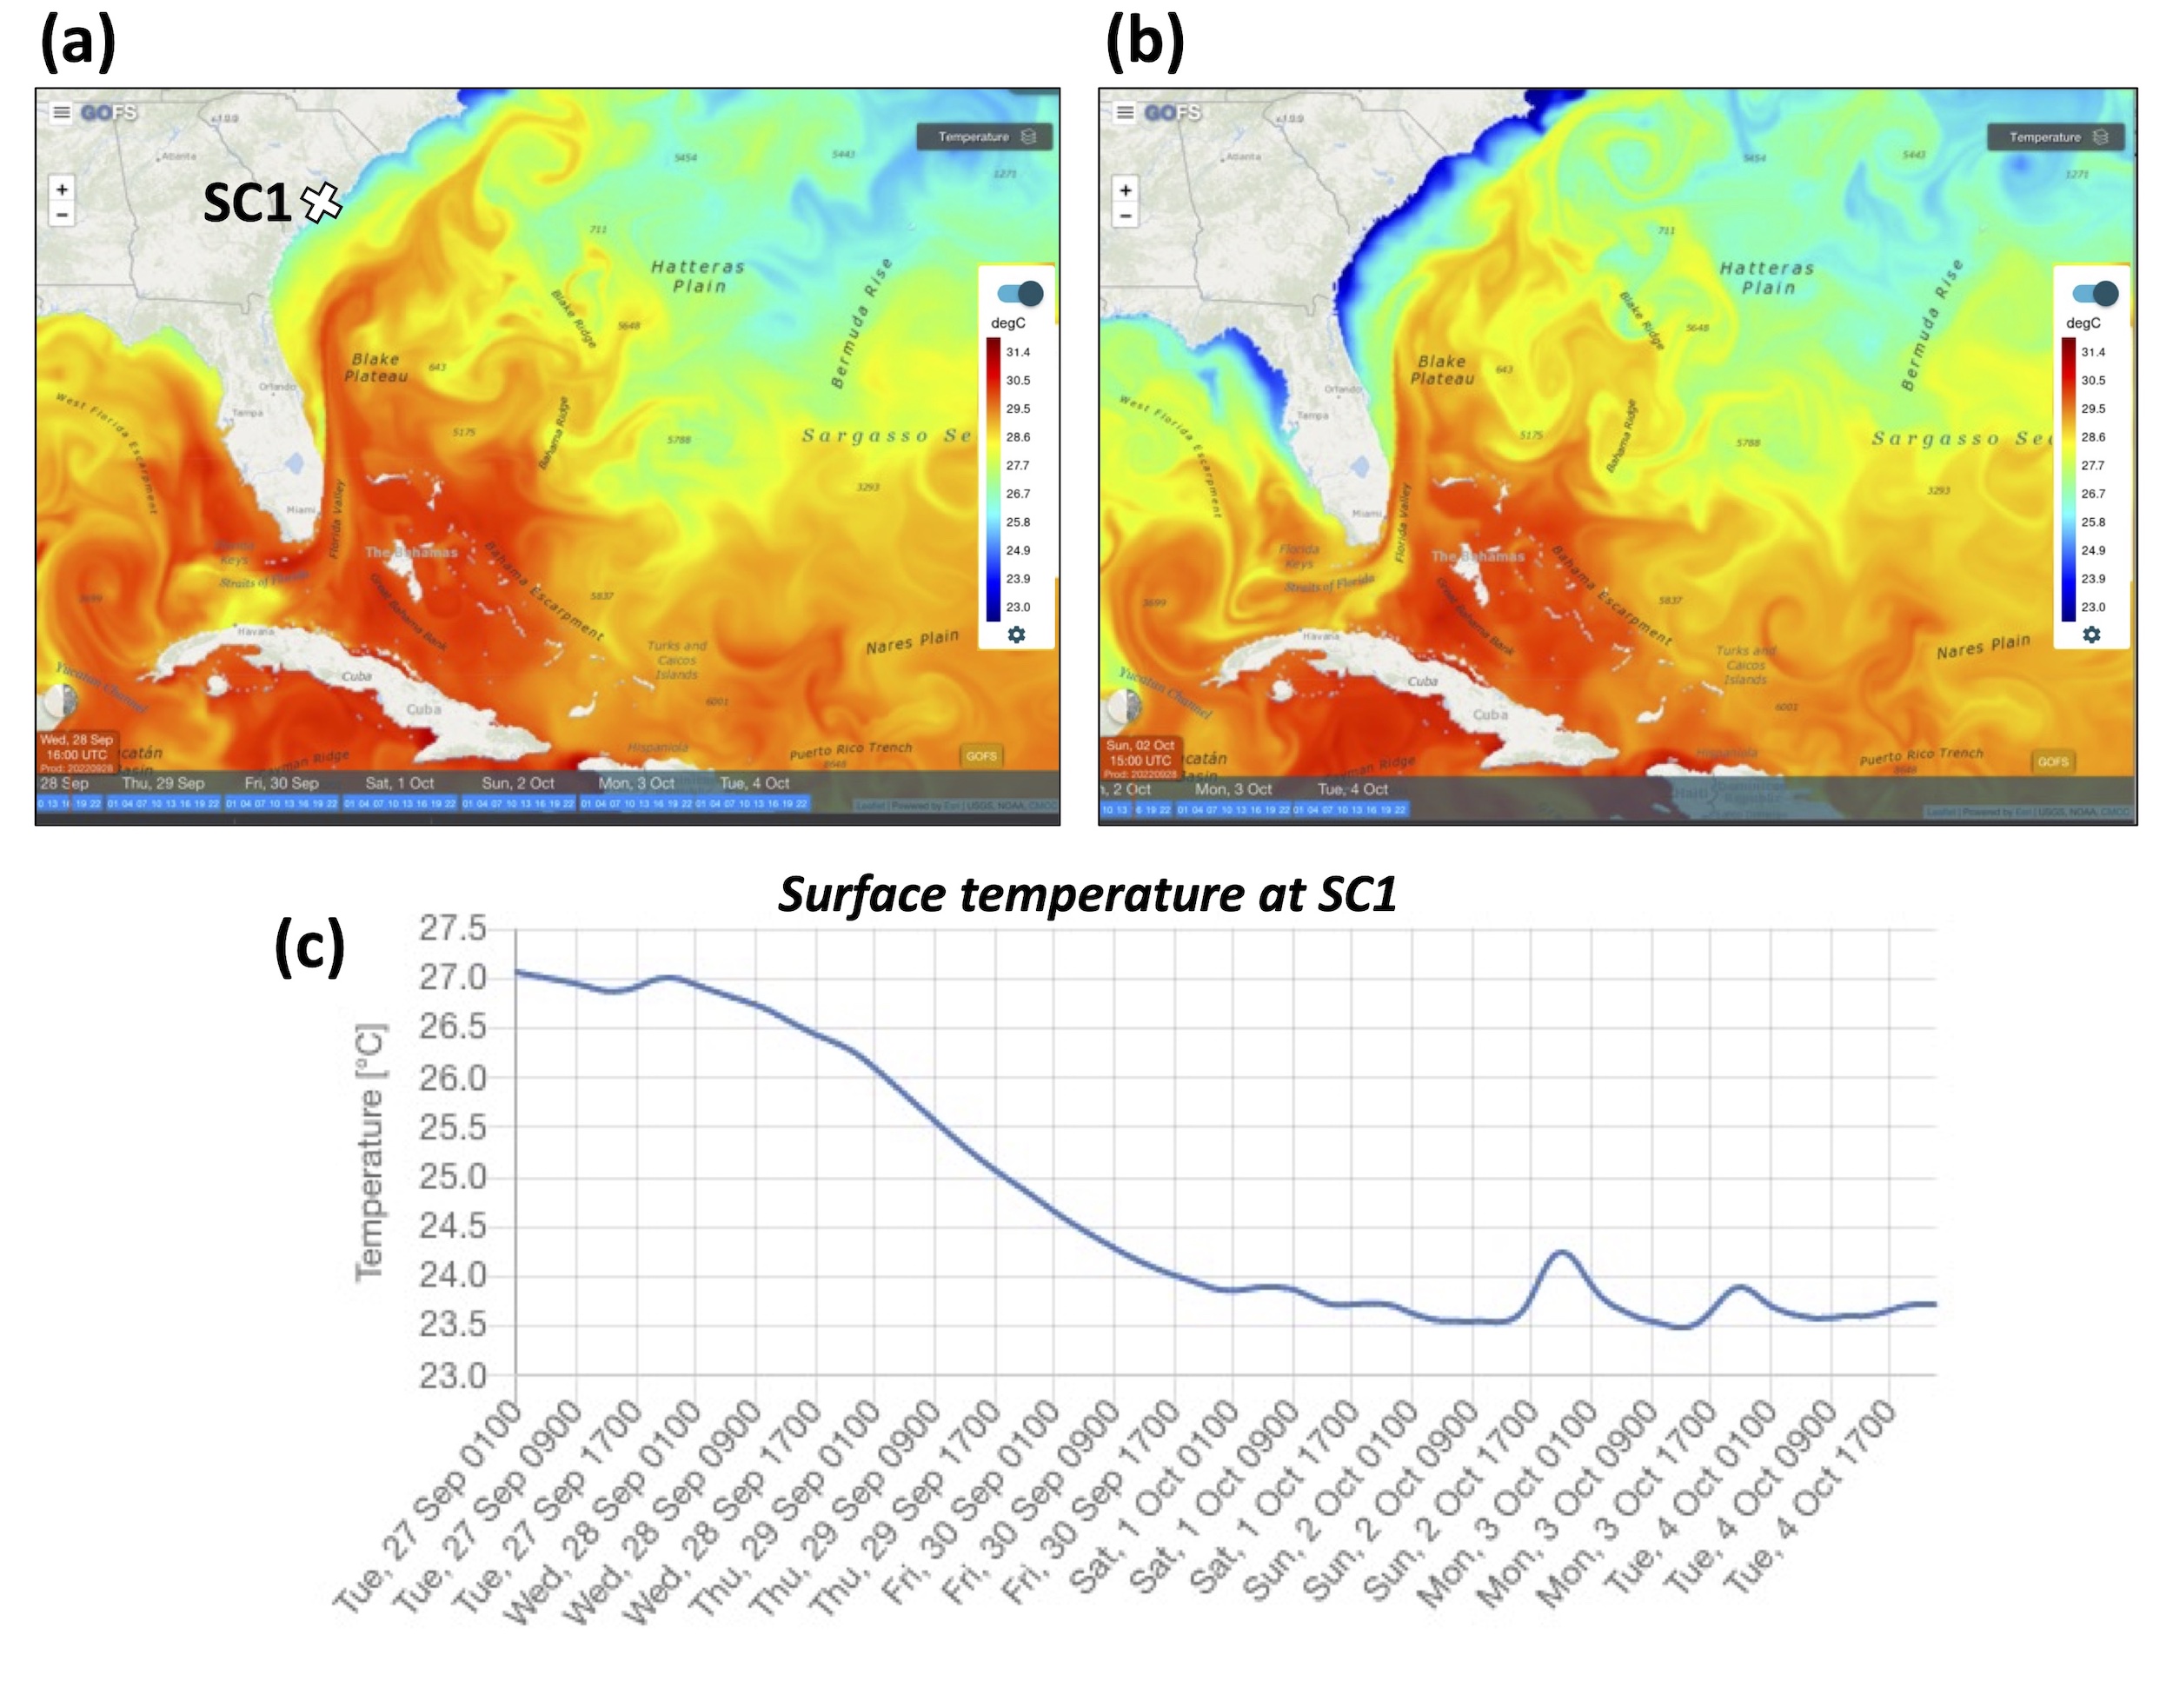
Figure 3: Sea Surface temperature predicted by CMCC GOFS on 28th September 2022 at 4 pm UTC (a) and on day 2nd October 2022 at 3 pm UTC (b). Surface temperature for the coastal point of South Caroline SC1.
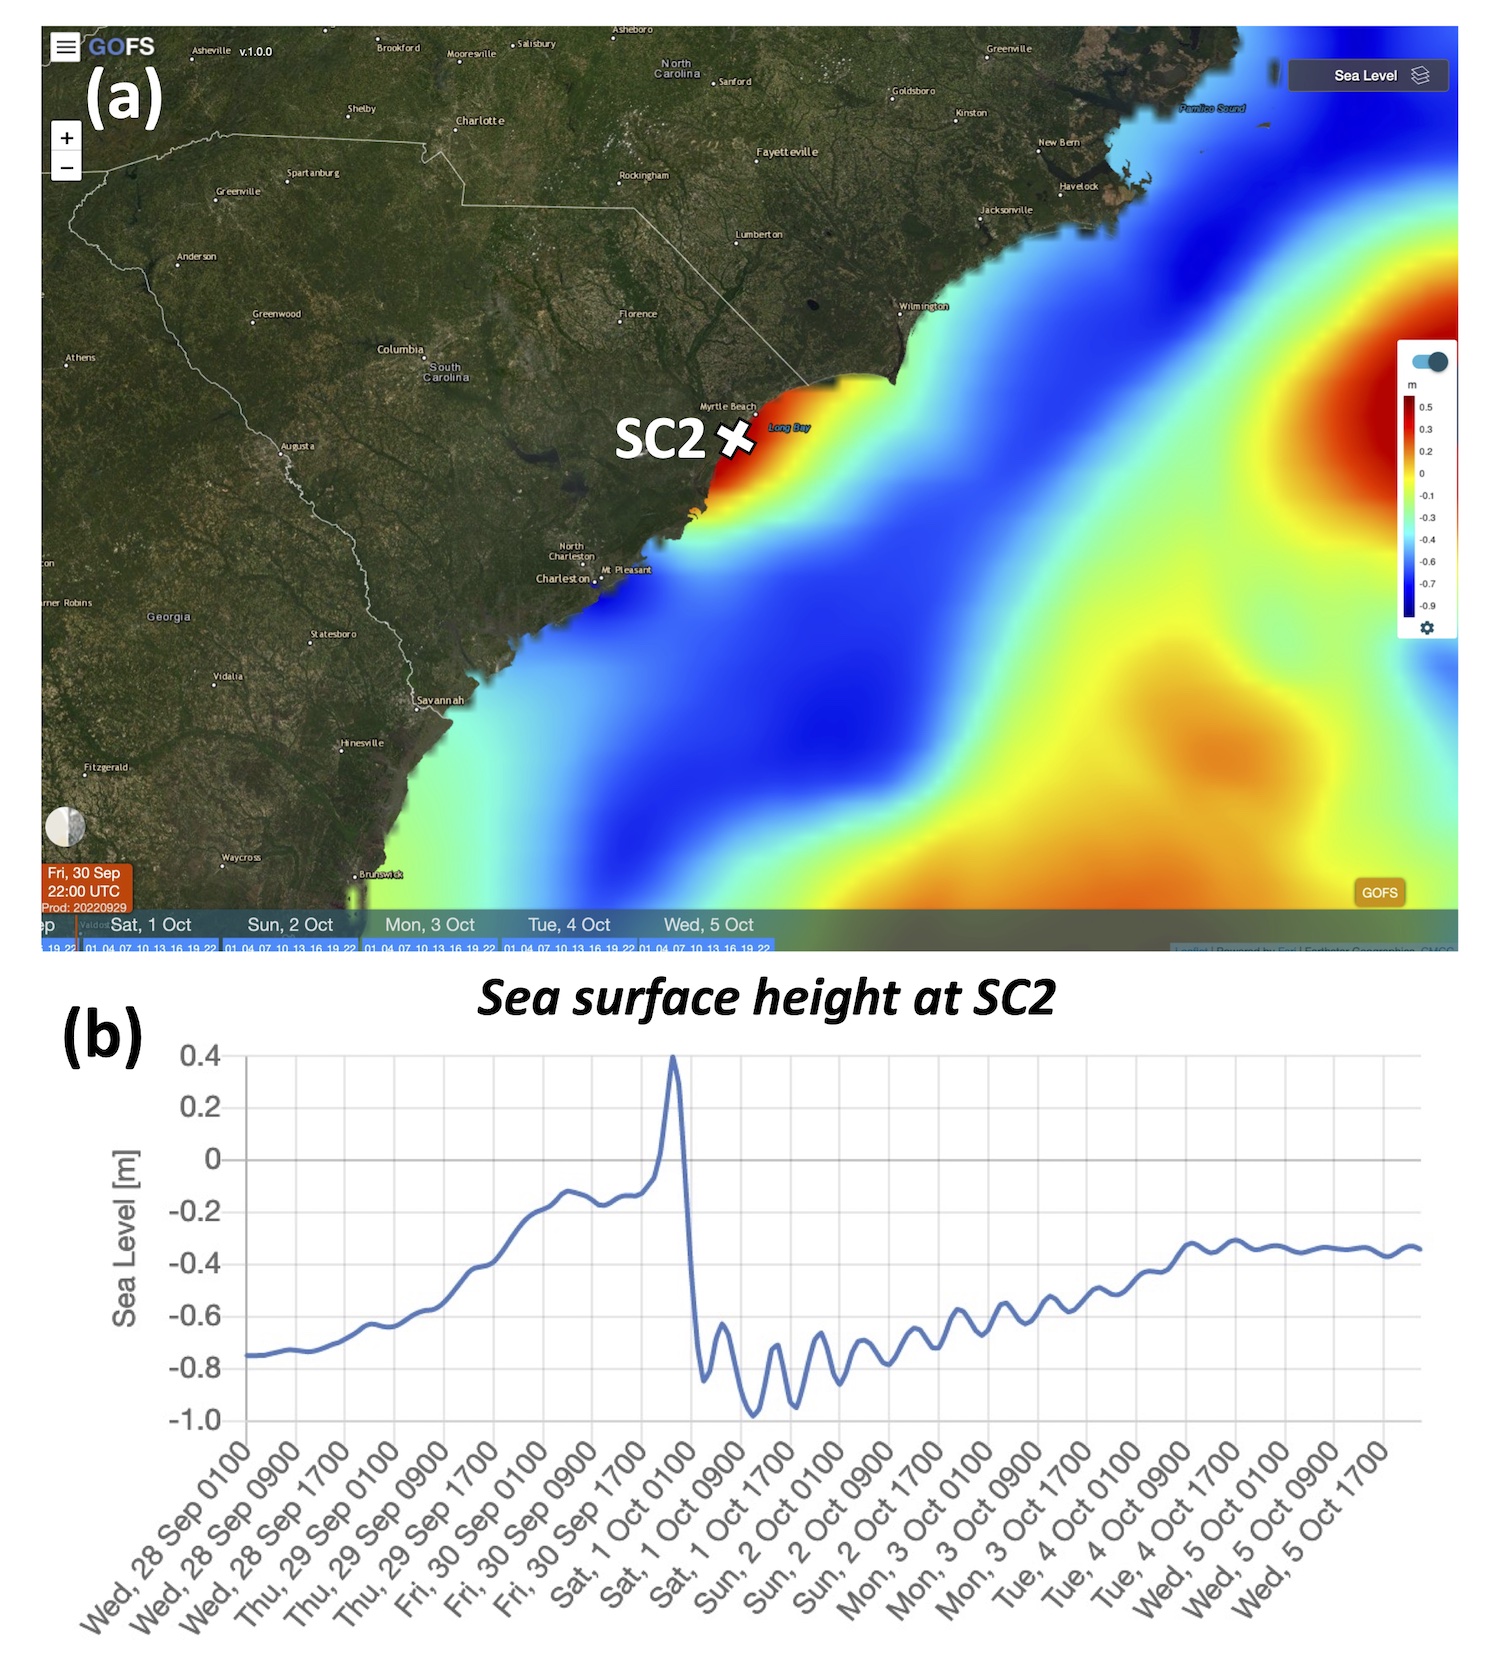
Figure 4: Sea surface height predicted by CMCC GOFS on 30th September 2022 at 20:00UTC (a). Time series of sea surface height for the coastal point SC2 in the Long Bay in of South Caroline (b).