The global map of aridity
Aridity conditions have now been mapped for the whole globe with a very high spatial resolution. This is a knowledge tool and database that helps detailed description and informed decisions to allow better land-use planning. Published in the Nature journal – Scientific Data with the contribution of the CMCC Foundation, the updated and improved database is presented in a study that paves the way for future aridity projections.
Precipitation alone does not properly characterize vegetation water stresses. Indeed, water needs of plants or crops to maintain their physiological processes – the evapotranspiration – depends on many meteorological and climatic variables, including solar radiation, air temperature, relative humidity and wind speed, as well as specific crop characteristics and cultivation practices.
Aridity indices are therefore implemented to measure the adequacy of the precipitation to satisfy vegetation water requirements, namely as ratio of annual precipitation to evapotranspiration of reference crop, or Potential EvapoTranspiration.
In a rapidly changing global environment and climate, these metrics and their derivative indices become a direct and critical measure, and predictive tool, of the trend, direction, and magnitude of climatic change and its impacts upon the terrestrial biosphere, with implications for plant growth, sustainable development, and eventually for human civilization.
An international team of scientists has released a set of updated and improved estimations of Potential Evapotranspiration and an Aridity Index for the entire world. The peer-reviewed article describing the database has recently been published in the Nature journal – Scientific Data. The database presents the values of the indices for the entire globe at a very high spatial resolution of approximately 1 km2 for the period 1970-2000, and as baseline for future projections.
CMCC author Antonio Trabucco has been contributing to the “Global Aridity Index and Potential Evapotranspiration Database” since 2009, when the first version of it was made available online. The third version of the database, now released, shows major improvements compared to previous versions, with more complex methods describing the full effect of different climate variables on evapotranspiration processes and relying on a richer meteorological dataset using the latest version of the WorldClim 2.0 database.
The database has already shown itself to be a valuable global public good with earlier versions, which have been downloaded nearly 50,000 times and applied across a wide range of scientific disciplines, with nearly 1500 citations. The topics of papers citing this dataset range from global environmental issues such as drought and wildfires, to human migration, pastoralism and desertification, wildlife and restoration ecology, child mortality, and epidemiological and other human and livestock health research, such as the effect of malaria control, or mapping the zoonotic niche of Ebola virus disease in Africa.
Dr. Robert Zomer, a Presidential Fellow of the Chinese Academy of Sciences at the Center for Mountain Futures and lead author of the paper said: “These datasets have been found useful across a wide variety of applications, particularly related, but not limited to water management and crop production, but also socio-ecological and socio-economic applications addressing sustainable development and climate change and can be particularly useful for local adaptation to global change.”
“The high resolution of the Global Aridity Index provides great potential to map the climatic-related and environmental risks,” said Prof. Jianchu Xu from Kunming Institute of Botany, also principal scientist at the World Agroforestry Center. Indeed, the high resolution of this work allows a finer and more targeted description of the water needs of different regions of the world and of the great variability within the same region, in order to make the best use of resources and for a better land-use planning.
Dr. Antonio Trabucco of the CMCC Foundation – Euro-Mediterranean Center on Climate Change emphasized the utility of this new, latest release, “Not only is the data improved, but publishing the source code used to develop this analysis makes it available for local and specific applications using local, improved, or updated climate data. We think that this database, and its source code, provide robust tools that can help to meet the challenges of a rapidly changing global aridity environment”.
In a changing climate, aridity tends to increase, especially in areas that already suffer from it. This work provides the basis for further studies exploring future trends of Aridity and Potential Evapotranspiration.
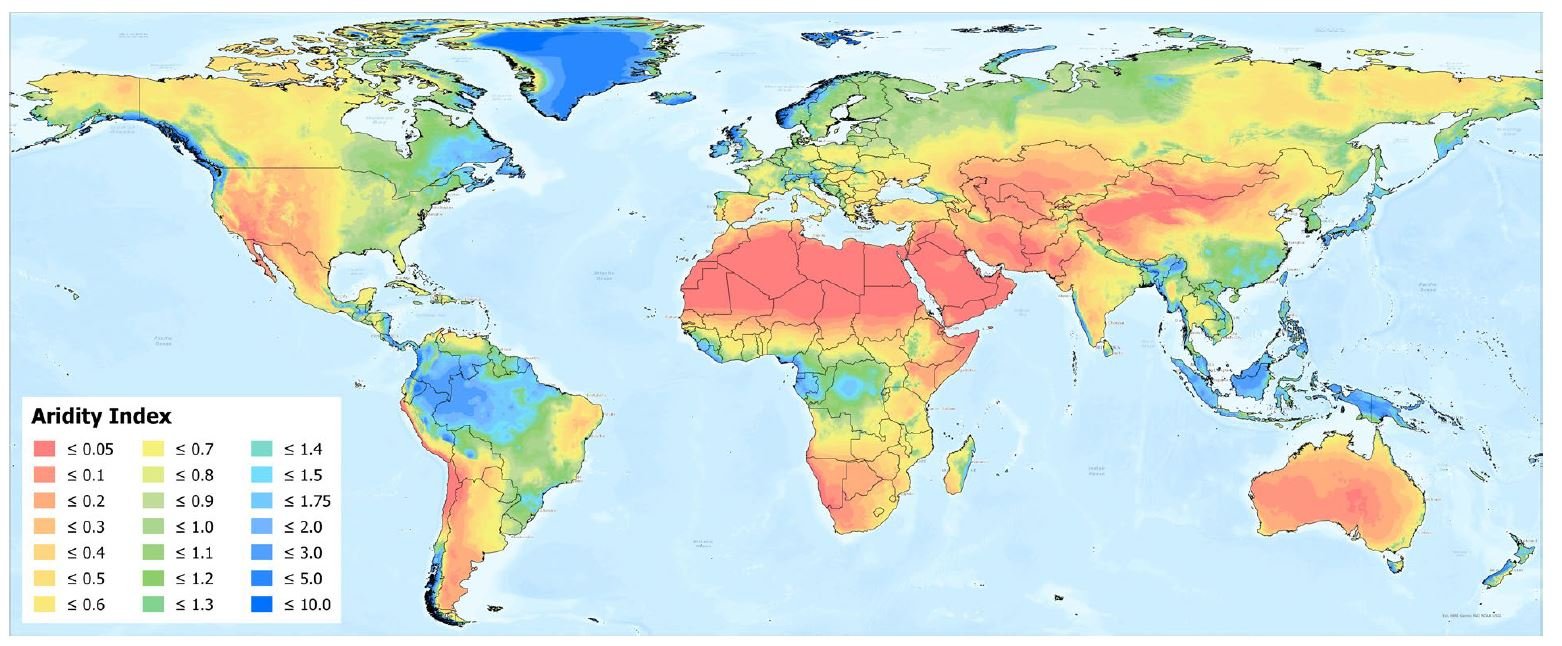
Global Aridity Index for the period 1970–2000. Higher values (green/blue colors) represent more humid conditions; low values (yellow/brown/red colors) represent higher aridity.
For more information
Zomer, R.J.; Xu, J.; Trabucco, A. 2022. Version 3 of the Global Aridity Index and Potential Evapotranspiration Database. Scientific Data 9, 409. https://www.nature.com/articles/s41597-022-01493-1