
The Sound of the Pacific
by Antonio Navarra, Laura Panzera
In 1932 and 1937 Sir Gilber Walker and his colleague E. Bliss wrote two papers that were to have huge repercussions on the history of meteorology. At the time of their writing there was a widespread approach of looking at the relations between various places of meteorological interest through simple correlations. In fact, it is significant that there is a note to the 1932 paper reporting a quote by Sir Napier Shaw’s “Manual of Meteorology” that reads: “the general impression which we derive from the voluminous literature of correlation is bewildering.” A comment that is probably still valid today.
However, Walker and Bliss wanted to extend the analysis beyond a bilateral correlation and sought to take into account other places that might collectively point to a systematic pattern of variation in the atmosphere. They therefore decided to define “indices”, namely a combination of parameters that could maximize the expression of the pattern. The issue was they had an intuition that the world was covered by a long train of oscillations that had multiple centers and that therefore required several parameters to describe it.
They looked at various ocean basins, and they created indices for the Atlantic sector, the North Atlantic Oscillation, the North Pacific and the South Pacific. Results were mixed, but in the South Pacific they were in for a surprise. Their original index was composed of: (Santiago pressure + Honolulu pressure + India Rain + Nile Flood + 0.7 Manila pressure) – (Batavia pressure + Cairo pressure + Madrid temperature + 0.7 Darwin pressure + 0.7 Chile rain).
Subsequently, it was revealed that all those parameters were not necessary, and the essence of the oscillation was actually captured by a simple difference in pressure between Tahiti and Darwin. Fig.1 shows the modern calculation of these indices for the entire period for which we have data. It is of course convenient that it is based on surface pressure data, a type of observation for which we have the longest records.
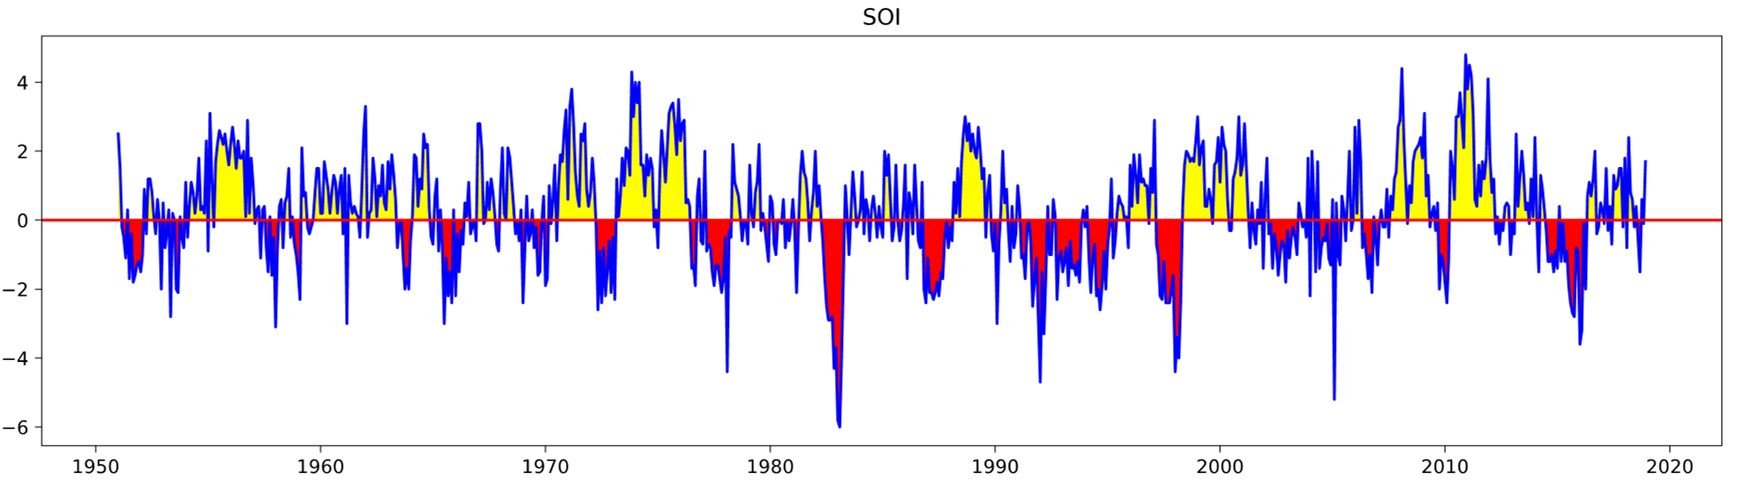
Figure 1: The Southern Oscillation index from 1950 to 2018
The negative phases correspond to periods of warming of the equatorial Pacific, like 1982-83, 1997-98 and so on, that we understand are part of a large oscillatory phenomenon called ENSO – El Nino/Southern Oscillation, that has revealed its coupled nature linking ocean and atmospheric variability on interannual scales. The atmosphere and the ocean in the Pacific are embraced in a whirling dance that has been going on for a long time and will continue for a long time.
But if they are dancing where is the music? It is tempting to explore the Sound of the Pacific by exploiting the correspondence between the waveform of the Southern Oscillation Index and acoustic oscillation, interpreting the time series of the index as sound. Here you can listen to the results.
Photo by Pierre Leverrier on Unsplash