Dataclime is a software, developed in GIS environment, with the main goal to manage climate data, link climate and impact studies and assist a wide range of users.
It is a user-friendly interactive web platform allowing users to evaluate multiple features of simulated and observed data over different geographical domains having local, national and continental extension.
Since many years, Dataclime service is used in several national and international projects and scientific publications for the realization of post processing analysis including high-level quality maps. During these years, this service has been enhanced by introducing several functionalities and additional climate data. In addition to analysis of climate data, Dataclime platform includes several methods to reduce the climate models bias (known as bias correction techniques) and is able to manage data available in different formats.
The Dataclime engine can quickly manage massive quantity of data performing the required analyses by own tools (C#) or by integrated pre-existing tools developed by users in different languages (e.g. Matlab exe, R packages…).
Dataclime is supported by an Import Data Module for the storage in a Geodatabase of simulated and observed climate data, available in the several formats adopted by end users.
Currently Dataclime includes different databases, with simulated climate data (performed by CMCC or by other international programs) and gridded and in situ observation data.
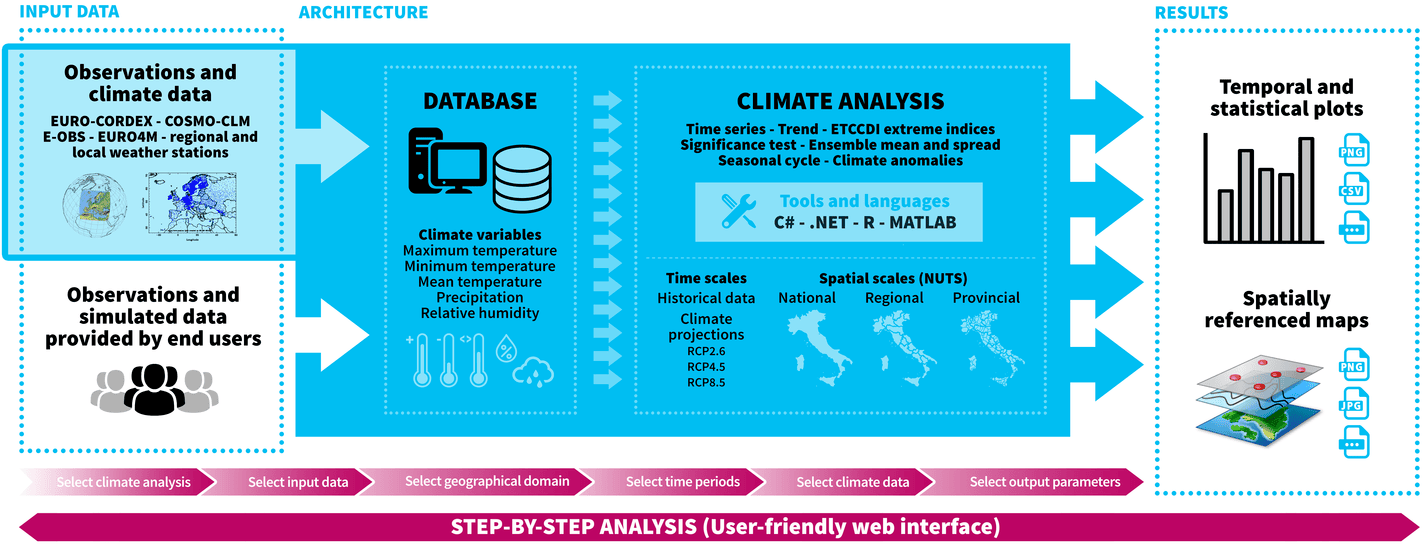
Dataclime is able to manage the whole information production chain: from climate data collection/storage to correction and processing of climate data according to user needs. Figure 1 shows a diagram illustrating the workflow of the Dataclime service.
The main functionalities are:
- Storage of massive quantity of climate data.
- Elaboration of different statistical analysis (e.g. time series, trend, ETCCDI extreme indices, seasonal cycle, ensemble mean and spread, climate anomalies, pdf).
- Customize climate analysis on different temporal and spatial scales.
- Visualization of results through temporal and statistic plots or spatially referenced maps with possibility to include different background (e.g. Google maps).
- Output of analysis available in different formats (tables, graphics and maps) easily accessible by other software for further analysis.
- Training materials (demo and help desk) through which the Dataclime team will follow step-by-step the user in his analyses.
The entire in-house development of Dataclime allows the users, through a graphical interface, to ask about development of new features, according with their needs and new data availability, and also to have support for the data interpretation, description and data publication.
References:
- Bucchignani E., Montesarchio M., Zollo A.L., Mercogliano P. (2015) – High-resolution climate simulations with COSMO-CLM over Italy: performance evaluation and climate projections for the XXI century. International Journal of Climatology DOI: 10.1002/joc.4379
- Bucchignani E., Mercogliano P., Rianna G., Panitz H.J. (2015) – Analysis of ERA-Interim-driven COSMO-CLM simulations over Middle East – North Africa domain at different spatial resolutions. International Journal of Climatology DOI: 10.1002/joc.4559
- Bucchignani E., Cattaneo L., Panitz H.-J., Mercogliano P. (2015) – Sensitivity analysis with the regional climate model COSMO-CLM over the CORDEX-MENA domain. Meteorology and Atmospheric Physics DOI: 10.1007/s00703-015-0403-3
- Bucchignani E., Zollo A.L., Cattaneo L., Montesarchio M., Mercogliano P. (2016) – Extreme weather events over China: assessment of COSMO CLM simulations and future scenarios. International Journal of Climatology (ISI/SCOPUS) DOI: 10.1002/joc.4798
- Cattaneo L., Rillo V., Manzi M.P., Villani V., Mercogliano P. (2015) – RP0257 – Clime: climate data processing in GIS environment – CMCC Research Paper
- Garcia A., Bucchignani E., Manzi M.P. (2015) – Patterns in climate-related parameters as proxy for rainfall deficiency and aridity: application to Burkina Faso. Journal of Risk and Uncertainty in Engineering Systems, Part A: Civil Engineering DOI: 10.1061/AJRUA6.0000860
- Montesarchio M., Zollo A. L. , Bucchignani E., Mercogliano P., Castellari S. (2014) – Performance evaluation of high-resolution regional climate simulations in the Alpine space and analysis of extreme events. Journal of Geophysical Research: Atmospheres, 119, DOI: 10.1002/2013JD021105.
- Villani V., Cattaneo L., Zollo A.L., Mercogliano P. (2015) – RP0262 – Climate data processing with GIS support: description of Bias Correction and Temporal Downscaling tools implemented in Clime software – CMCC Research Paper
Contacts:
Paola Mercogliano – REMHI Division
Giuliana Barbato – REMHI Division
Nicola Ciro Zollo – REMHI Division
[email protected]


