



Visualising Climate 2026
4 November 2026, h. 18:00 – 19:00 | Bologna, Italy – Botte B4 Pavilion at the DAMA Technopole
Learn more
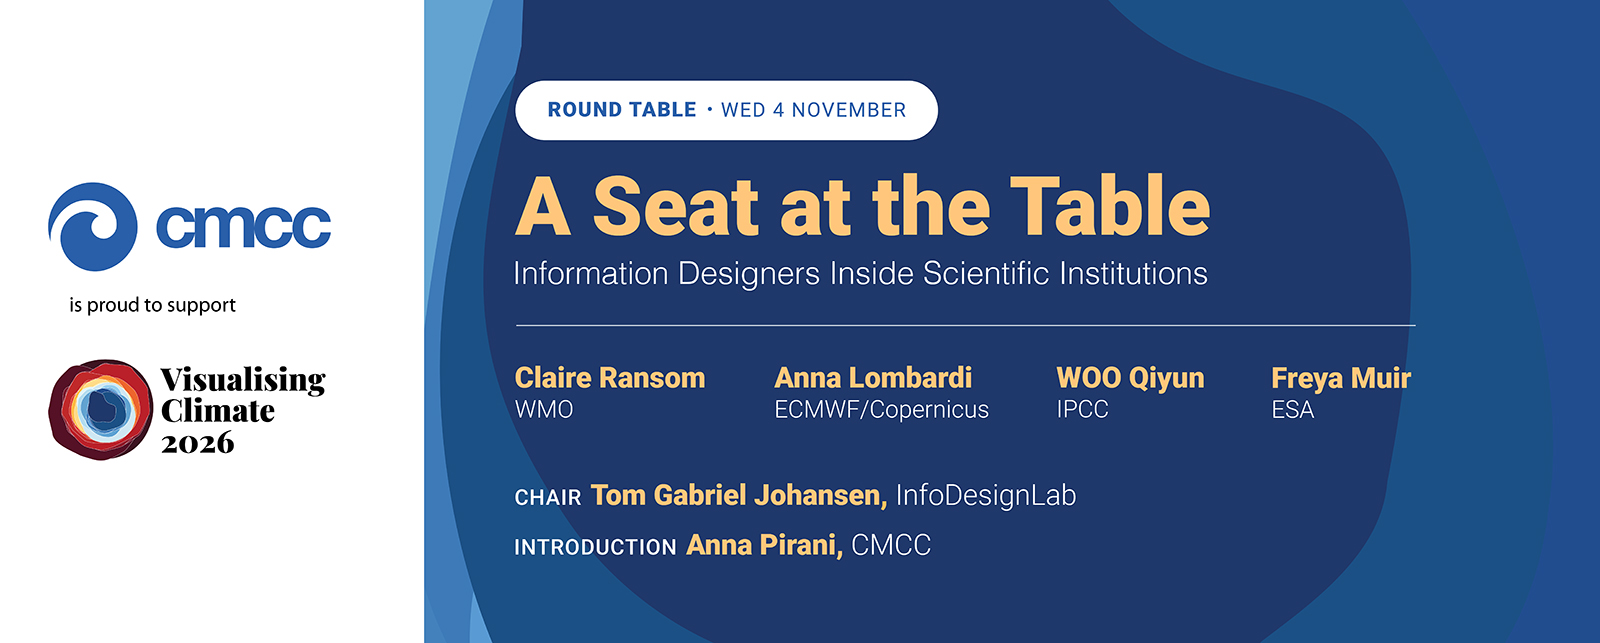
The Euro-Mediterranean Center on Climate Change (CMCC) takes part in Visualising Climate 2026, the first global conference dedicated to data visualisation for climate and environmental sciences, taking place in Bologna, Italy, from 4 to 6 November 2026.
As part of the conference programme, CMCC contributes to the round table “A Seat at the Table: Information Designers Inside Scientific Institutions”, scheduled for 4 November 2026, from 18:00 to 19:00.
Major scientific institutions have begun employing information designers and data visualisation experts, laying a foundation for a more professional field. In this roundtable, introduced by CMCC Senior Scientist Anna Pirani, practitioners from WMO, ECMWF/Copernicus, IPCC and ESA discuss what this shift looks and feels like today: new recognition and opportunities, alongside vulnerability, pressure and the growing impact of AI. Having earned a seat at the table, how does the profession keep developing, and where is it going?
Panelists:
- Claire Ransom, WMO
- Anna Lombardi, ECMWF/Copernicus
- WOO Qiyun, IPCC
- Freya Muir, ESA
Chair: Tom Gabriel Johansen, InfoDesignLab
Introduction: Anna Pirani, CMCC
This is an in-person only event. More information on the dedicated website.
Visualising Climate 2026 is the first global conference dedicated to data visualisation for climate and environmental sciences, taking place in Bologna, Italy, from 4 to 6 November 2026.
Over three days of talks, workshops, and informal conversations, participants will delve into how data can be visualised to inform, engage, inspire action, and influence policy. This summit, bringing together scientists, artists, communicators, and journalists, is a space to share tools, techniques, and case studies that push the boundaries of visual narratives, foster interdisciplinary collaboration and co-creation, and empower change through data visualisation.